

Get Empowered: Review Window and the Processing Method | Tip #33
 160
160 
By Neil Lander September 7, 2017
Tip #33: Reusing an Older Calibration Curve
Welcome back to Get Empowered! In the last Empower tip-of-the-week blog for Empower Software, we explored how to overlay a chromatogram at a particular wavelength from two different 3D PDA channels. This week we will learn how to reuse an older calibration curve for quantification.
From time to time I get the question of how to use an older calibration curve to quantitate samples. Every time you calibrate, Empower assigns a Calibration ID to the calibration curves generated. If you want to use a calibration curve other than the current one, you need to select the older curve using the Calibration ID number. Sound difficult? Not really.
Let me show you.
Step 1
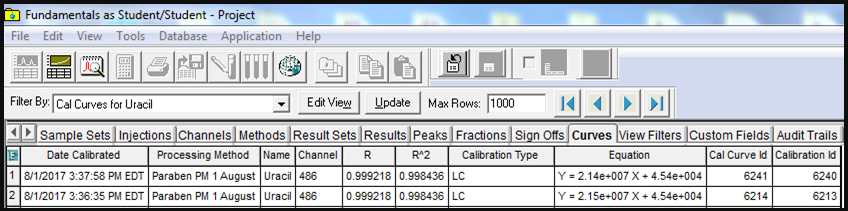
Let’s start from the Curves tab in Empower Softwarae’s Browse Project. The current calibration has ID 6240 and the older calibration has ID 6213 (Figure 1). Let’s first look at the difference between them using the Compare window. (You may recall we covered that in Tip 8, Comparing Calibration Curves.)
Step 2
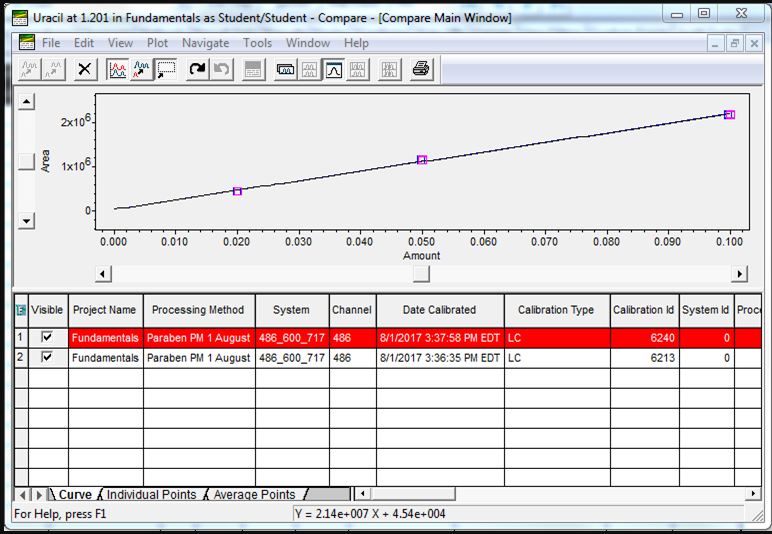
In Compare Window with Calibration ID 6240 highlighted, click the Individual Points tab (Figure 2).
Step 3
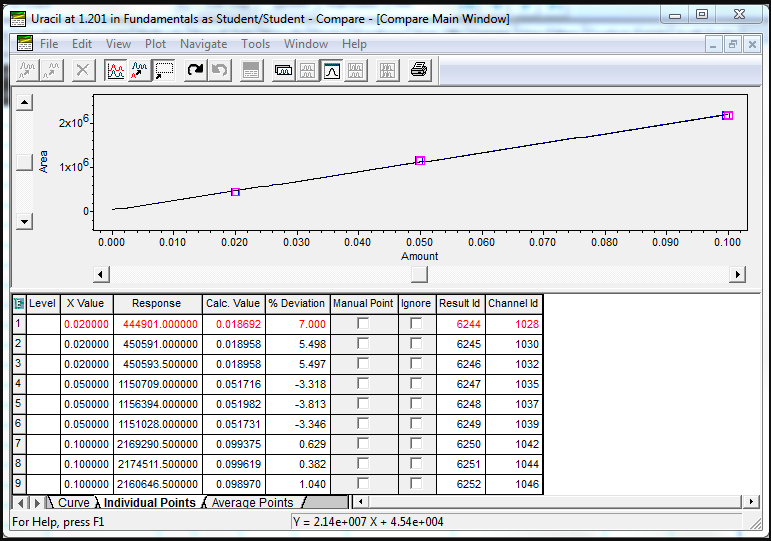
The X Values for the three levels are 0.02, 0.05, and 0.1 respectively (Figure 3).
Step 4
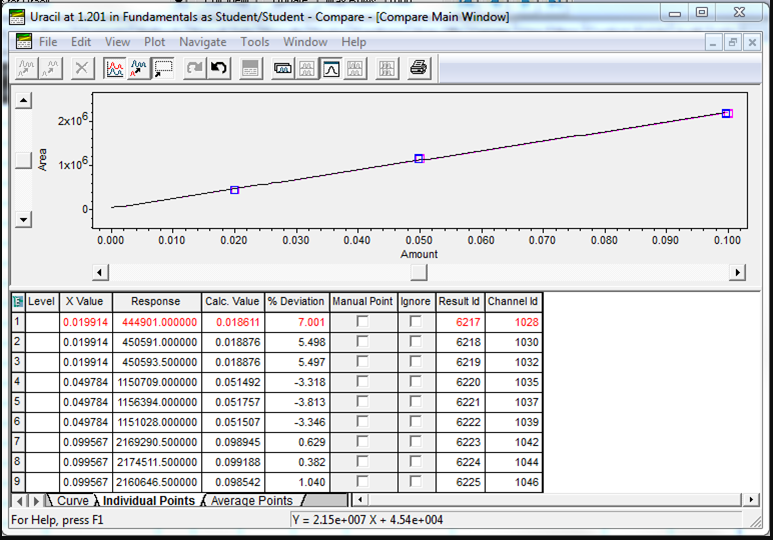
The older Calibration ID of 6213 has X Values that are slightly lower due to a Purity factor that was applied (Figure 4). Our goal is to use this older calibration curve where the Purity factor had been applied.
Step 5
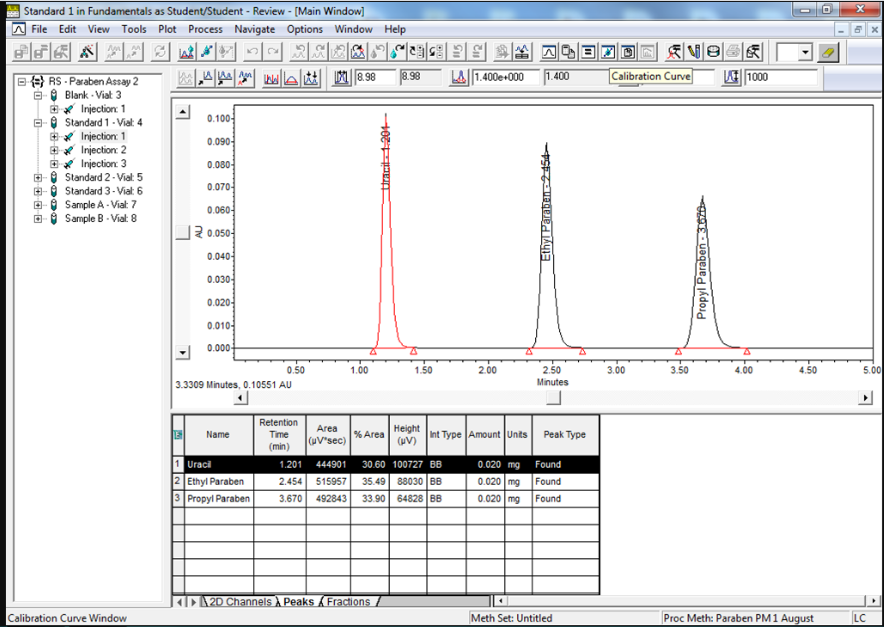
Let’s now bring a Result Set or a Result into Review and click the Calibration Curve tool (Figure 5).
Step 6
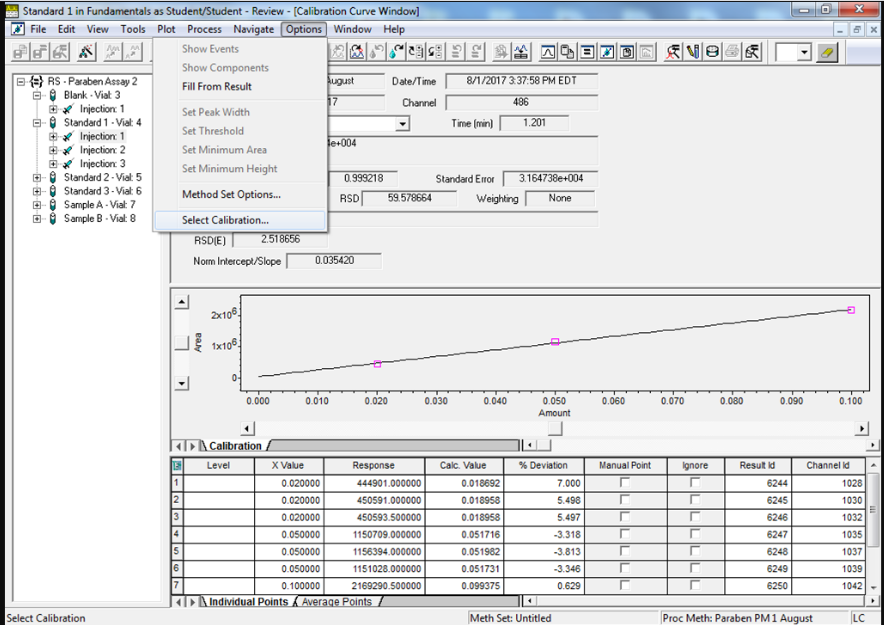
In the Calibration Curve window go to Options, Select Calibration (Figure 6).
Step 7
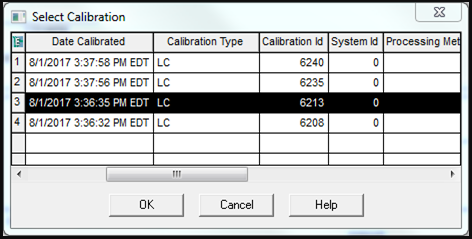
Select the Calibration Curve you want to use (in this case Calibration ID 6213) and click OK (Figure 7).
Step 8
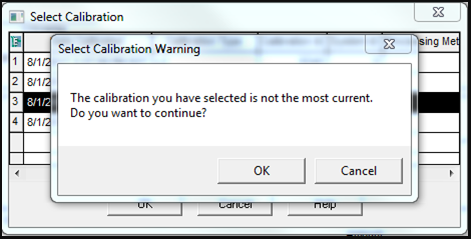
Click OK to the warning message that says the calibration you have selected is not the most current (Figure 8).
Step 9
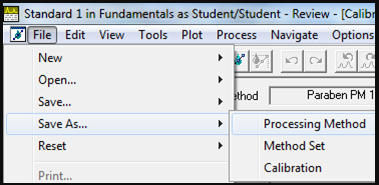
Calibration curves are associated with the processing method, so from the File menu select Save As, Processing Method to give the method a different name (Figure 9).
Step 10
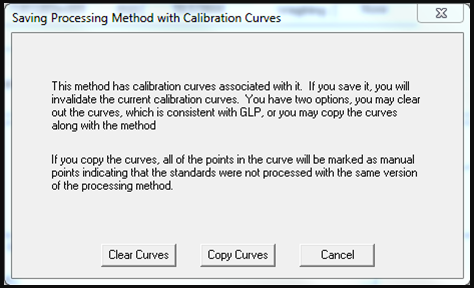
You will be asked to Clear Curves or Copy Curves. Select Copy Curves (Figure 10).
Step 11
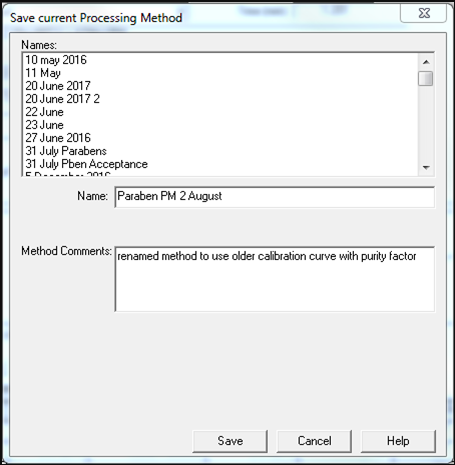
Enter a new name for the Processing Method and click Save (Figure 11).
Step 12
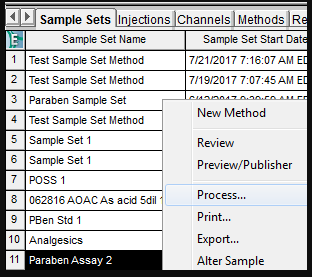
Exit from Review and now process the Sample Set using the older calibration curve. Go to the Sample Sets tab in Browse Project, right-click on the Sample Set and select Process (Figure 12).
Step 13
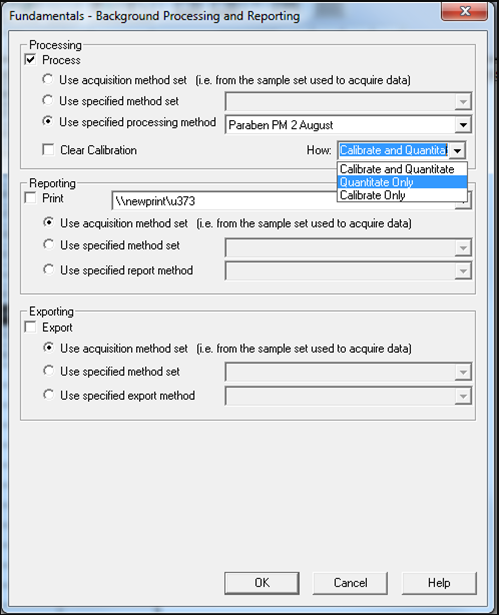
In the Background Processing and Reporting dialogue box select the Processing Method with the different name, and from the How drop-down menu select Quantitate Only (Figure 13). Then click OK.
Step 14
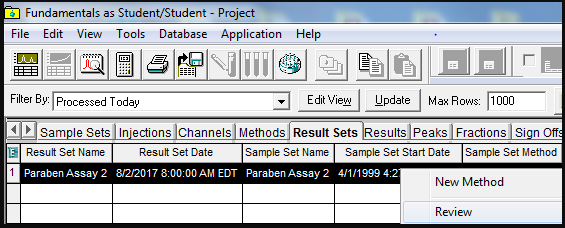
Go to the Result Sets tab, right-click on the new Result Set and select Review (Figure 14).
Step 15
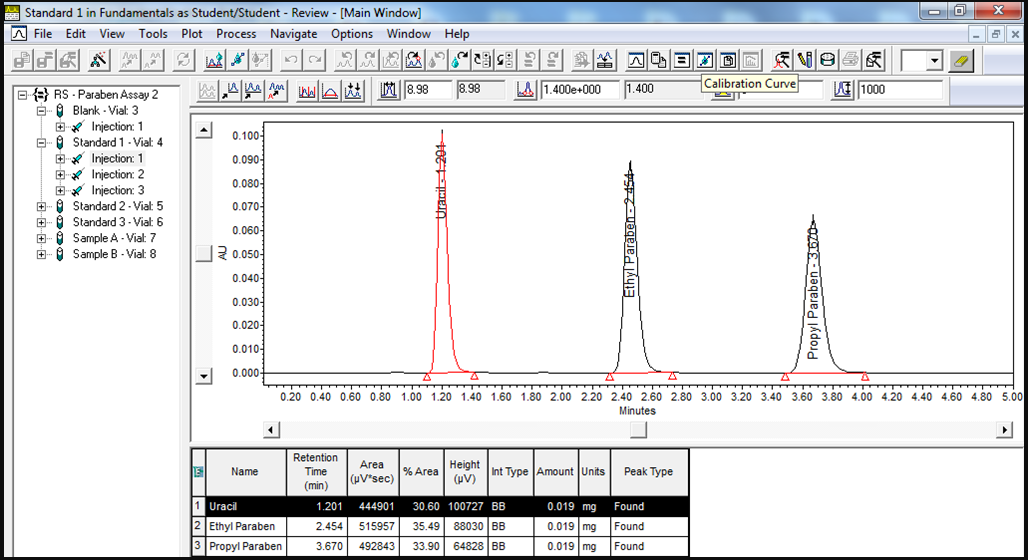
Click the Calibration Curve tool (Figure 15).
Step 16
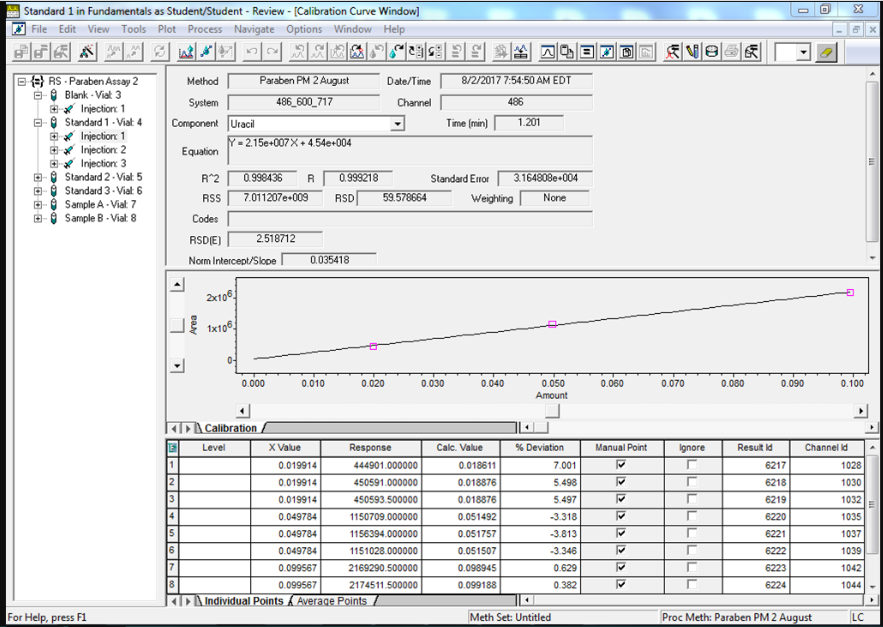
As seen in our example, the X Values for Uracil are from the older calibration curve (Figure 16).
Step 17
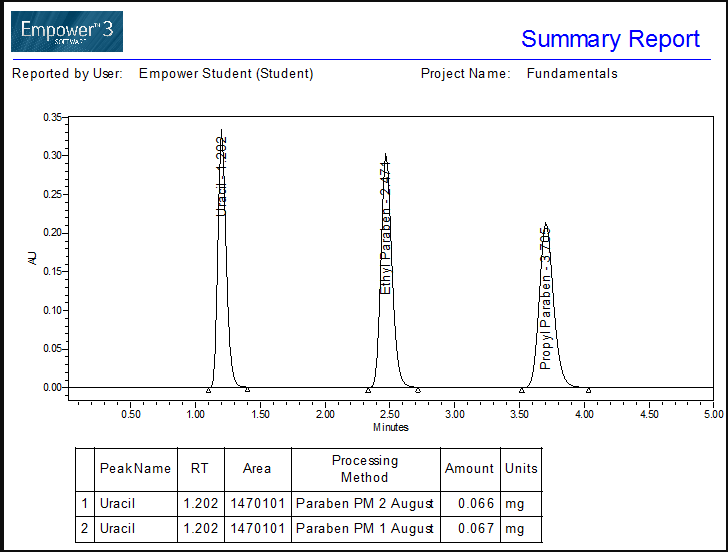
If we compare the results for a sample, we see a different calculated amount for Uracil when we use the older calibration curve (Figure 17). Want to know how to create this report? Stay tuned for future tips on Report Methods.
It’s that easy!
Final notes:
- This procedure can be followed using Empower’s QuickStart or Pro interface with 1 exception – the Compare window is accessed only through the Pro interface. Otherwise, the rest of the procedure can be followed.
- You could start with raw data (Sample Set, Injection, or Channel). Once you take the raw data into Review, open the Processing Method and then proceed from step 6.
- Typically this would not be seen as good practice in a regulated laboratory.
Next week in Empower Tip #34: Extracting Chromatograms and Spectra from 3D PDA Data (Part 1)
More resources:
- Want to learn more? Check out our Empower training courses and eLearning
- See all of our tips for using Empower CDS Software
- Comments? Connect with at #EmpowerTips or @WatersCorp on Twitter.
- Submit an Empower 3 Review with Select Science. Write a review.