

Get Empowered: Review Window and the Processing Method | Tip #30
 179
179 
By Neil Lander August 15, 2017
Tip #30: Calculating signal-to-noise ratio (Part 3)
Welcome back to Get Empowered! In the last Empower tip-of-the-week blog for Empower Software, we explored the second way to calculate signal-to-noise ratio (part 2). This tip will demonstrate the third option.
If you work in a pharmaceutical company, you follow the pharmacopeia for your methodology. There are two ways Empower can calculate signal-to-noise (S/N) ratio adhering to the pharmacopeia. This tip will address calculating noise from a blank injection.
- Part 1, calculating S/N using peak height divided by noise (#28)
- Part 2, calculating S/N from within a chromatogram (#29)
- Part 3, calculating S/N from a blank injection (#30)
- Part 4, using custom calculations to determine S/N (#31)
Step 1
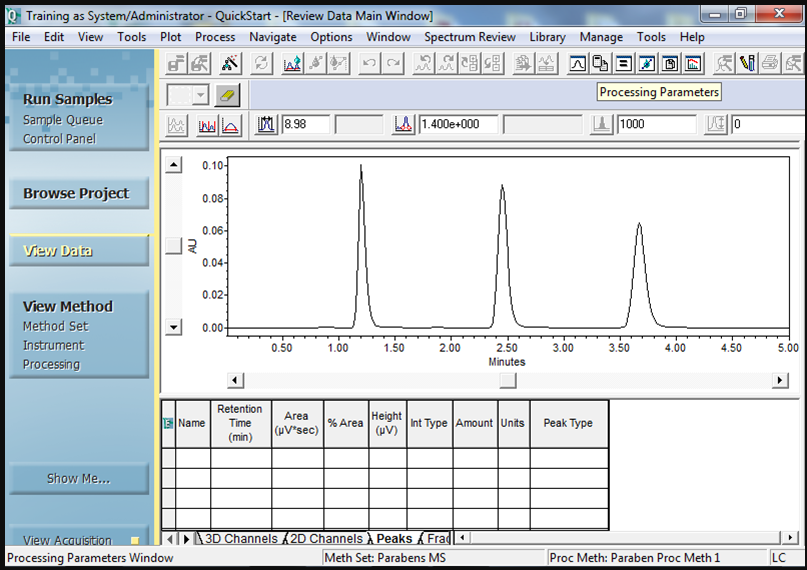
Bring raw data (Channels, Injections, or Sample Set) into Review and open the processing method. Click the Processing Parameters tool (Figure 1).
Step 2
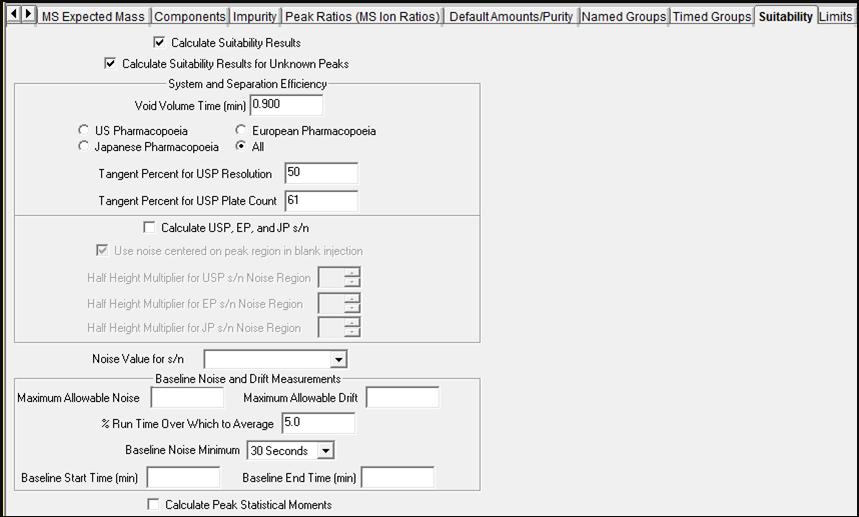
Click the Suitability tab and check the box that says Calculate Suitability Results. Enter the Void Volume Time, an estimate is fine (Figure 2).
Step 3
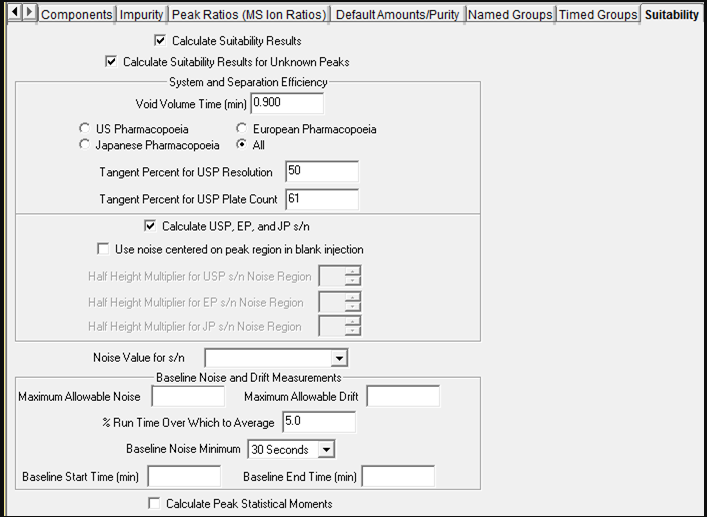
Select Calculate USP, EP, and JP S/N (Figure 3).
Step 4
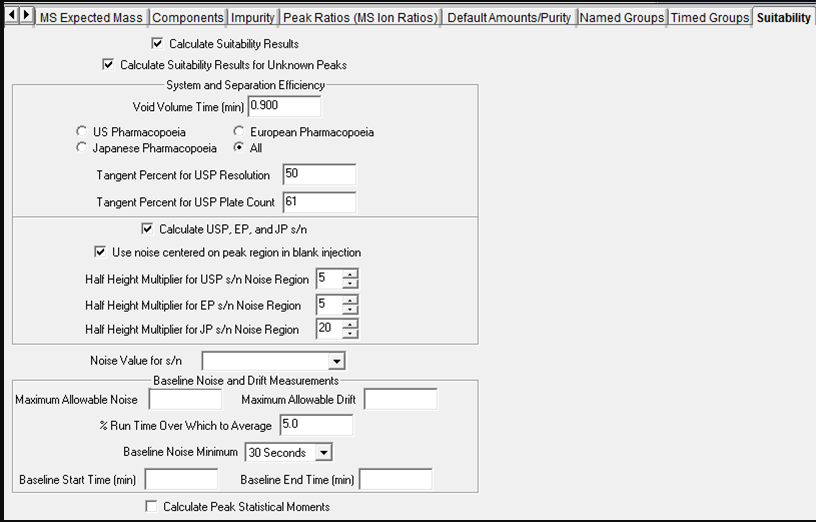
Select “Use noise centered on peak region in blank injection” (Figure 4). Empower calculates peak-to-peak noise from the expected retention time for the peak(s) in the blank injection. The half-height multipliers set the window of time Empower uses to calculate noise in the blank injection. For example, Empower calculates the half height width of a peak and multiplies by the value in the half-height multiplier field. If the peak width was 15 seconds at half height and the multiplier is 5, then the window would be 75 seconds. It does this for each peak.
Step 5
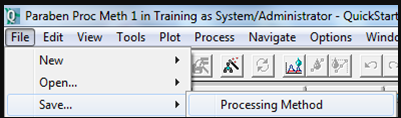
Save all changes to the Processing Method and return to Browse Project (Figure 5).
Step 6
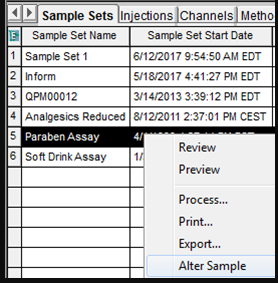
Now we need to identify the blank injection in the Sample Set. On the Sample Sets tab, right-click on the Sample Set and select Alter Sample (Figure 6).
Step 7
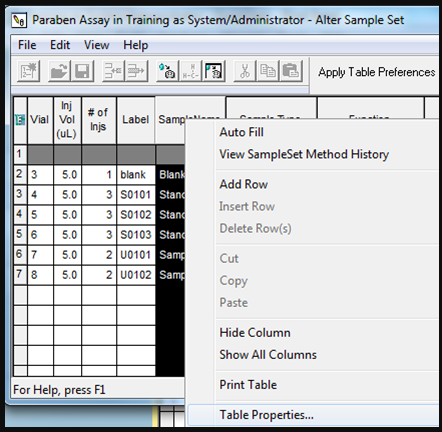
Right-click on the table and select Table Properties (Figure 7).
Step 8
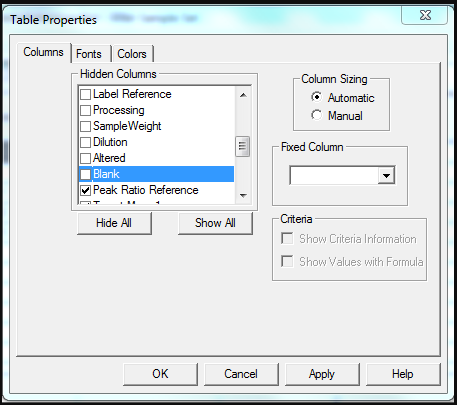
On the Columns tab, find the Blank field and deselect the check mark, then click OK (Figure 8).
Step 9
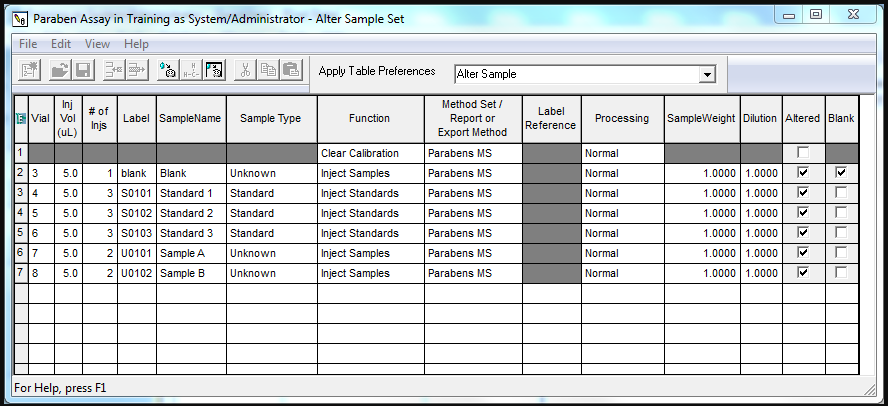
Now that the Blank field is added to the table, check the box for the blank injection (Figure 9).
Step 10
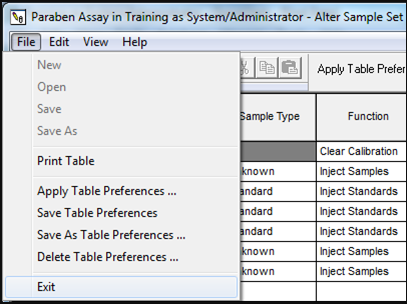
Save all changes and exit out of Alter Sample (Figure 10).
Step 11
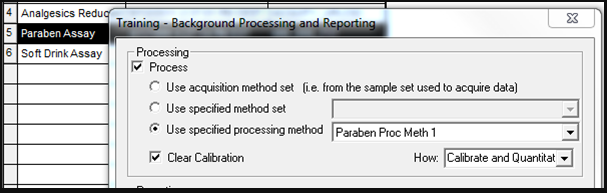
Process the data (Figure 11).
Step 12
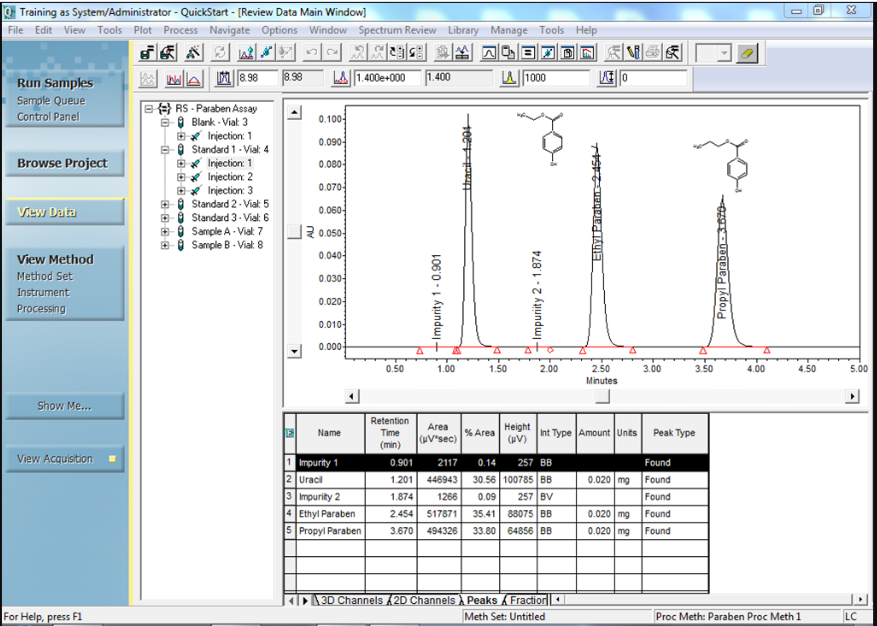
Bring the Result Set or an individual Result into Review (Figure 12).
Step 13
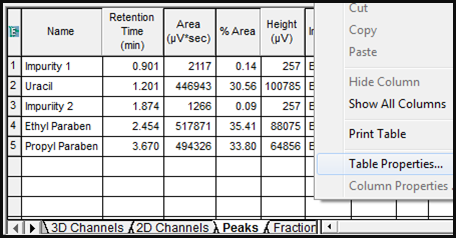
USP S/N, EP S/N, and JP S/N are hidden fields by default so let’s add one to our Peaks table. Right-click on the Peaks table and select Table Properties (Figure 13).
Step 14
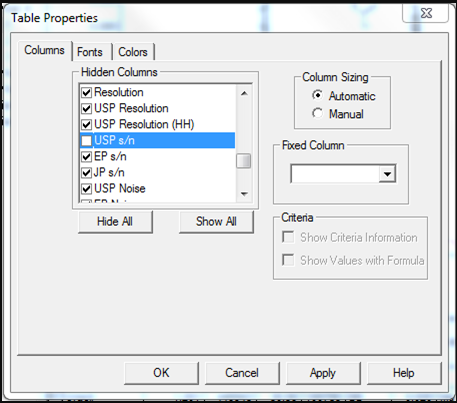
On the Columns tab, find USP S/N and remove the check mark to make it visible in the table (Figure 14). Click OK.
Step 15
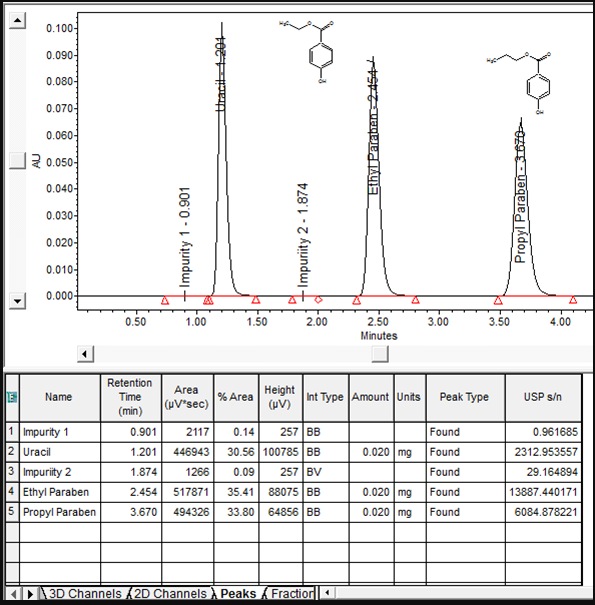
The USP signal-to-noise ratio is displayed for every integrated peak (Figure 15).
Step 16
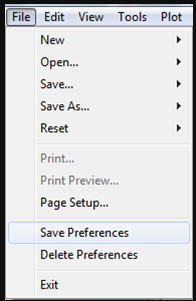
To keep the USP S/N field in the peaks table, select Save Preferences from the File menu (Figure 16).
It’s that easy!
Final notes:
- You must have the System Suitability option and enable it in the project.
- This procedure can be followed for both the QuickStart and Pro Interfaces.
Next week in Empower Tip #31: Calculating Signal to Noise Ratio (Part 4)
More resources:
- Want to learn more? Check out our Empower training courses and eLearning
- See all of our tips for using Empower CDS Software
- Comments? Connect with at #EmpowerTips or @WatersCorp on Twitter.
- Submit an Empower 3 Review with Select Science. Write a review.