

Get Empowered: Review Window and the Processing Method | Tip #34
 150
150 
By Neil Lander September 12, 2017
Tip #34: Extract Chromatograms and Spectra from 3D PDA Data (Part 1)
Welcome back to Get Empowered! In the last Empower tip-of-the-week blog for Empower Software, we explored how to use an older calibration curve to quantitate samples. This week we will learn one of the ways to extract chromatograms and spectra from 3D PDA data. (Part 1)
Often times I want to use my photodiode array (PDA) detector for qualitative purposes, that is, to collect my data over a wavelength range and then look at the chromatogram at different wavelengths and the spectra for the various peaks. I want to do this without developing a processing method or deriving channels in a method set. There are several ways to do this. Here is one simple approach.
Step 1
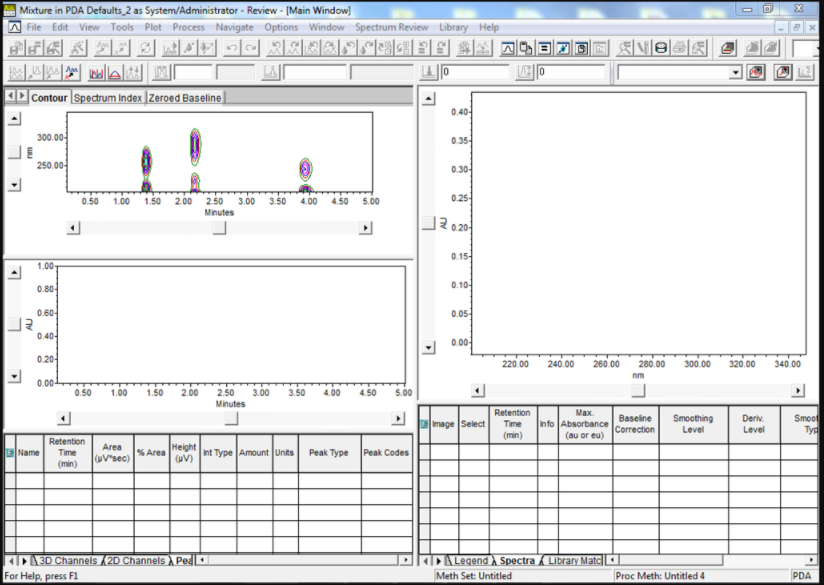
Let’s start by bringing a 3D PDA channel into review (Figure 1). You can use injections or sample sets, depending on your preference.
Step 2
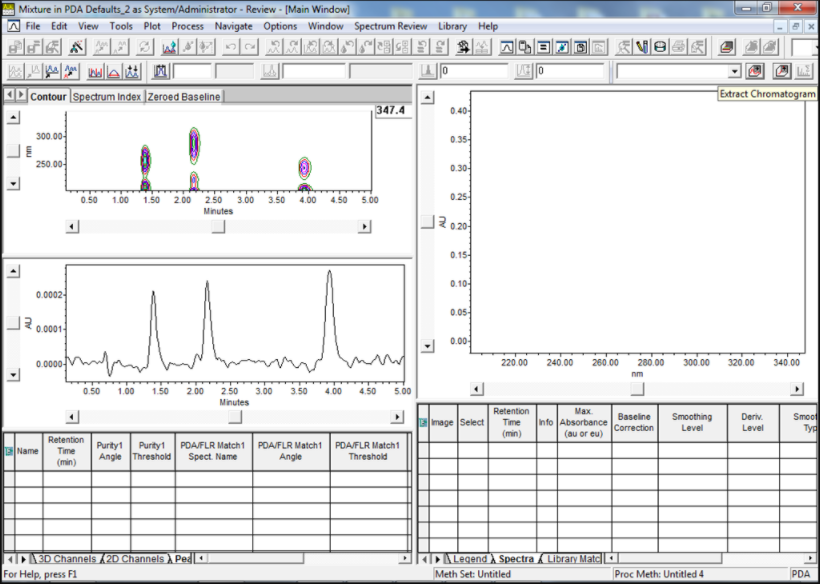
Click the Extract Chromatogram tool and a wavelength marker appears to right of the contour plot (Figure 2).
Step 3
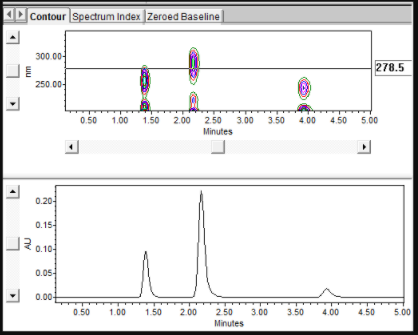
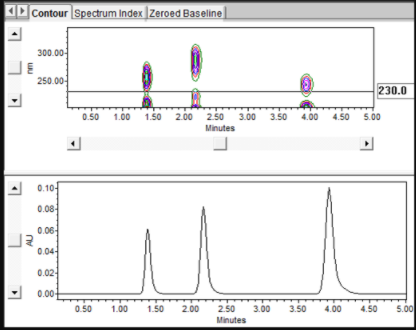
Using the mouse, slide the marker to the desired wavelength. The chromatogram appears in the chromatogram plot (Figure 3).
Step 4
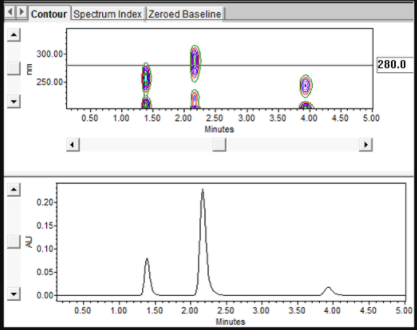
You can also double-click inside the marker, enter a specific wavelength, and press the enter key to move to a desired wavelength (Figure 4).
Step 5
Let’s repeat steps 2 and 3 to extract another chromatogram (Figure 5).
Step 6
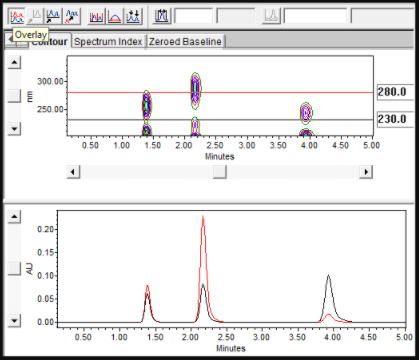
Click the overlay tool to compare the chromatograms (Figure 6).
Step 7
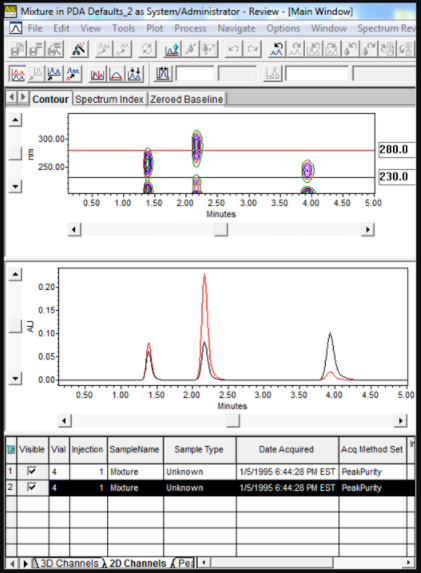
Finally, click the 2D Channels tab in the lower left portion of the window to display a table listing of the extracted chromatograms (Figure 7).
That was easy! Now let’s look at the spectra for the peaks.
Step 8
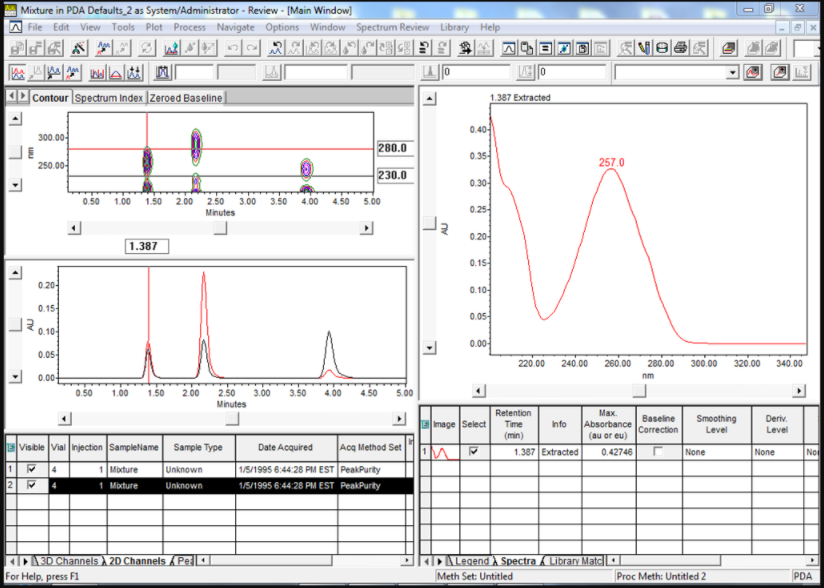
Click the Extract Spectrum tool. A marker appears along the time axis of the contour plot (Figure 8).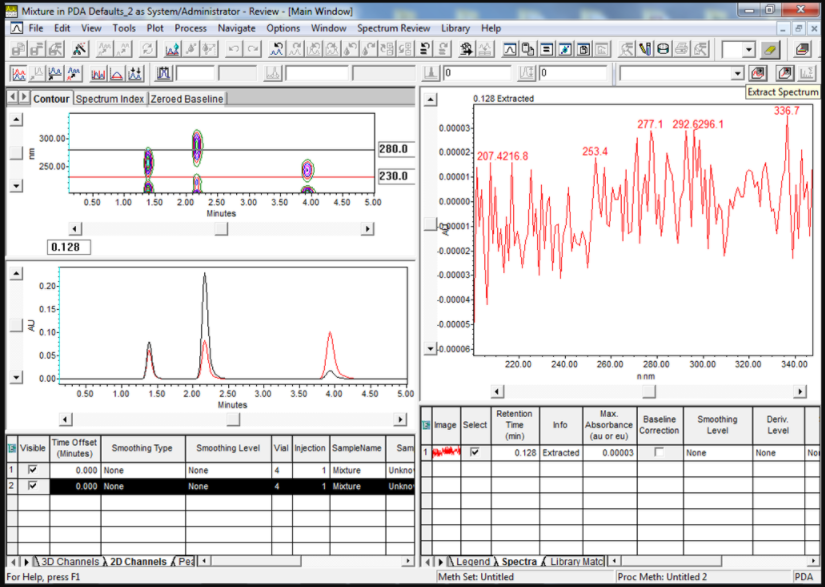
Step 9
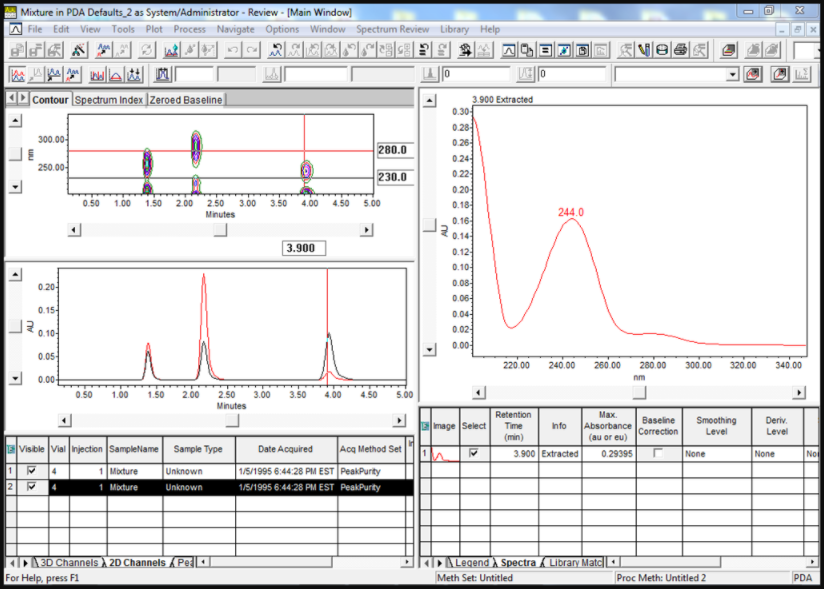
Using the mouse, drag the cursor to a peak. The spectrum is displayed in the Spectrum Review window (Figure 9).
Step 10
You can also double click inside the marker, enter a specific time, and press the enter key to move to a desired peak (Figure 10).
Step 11
Repeat steps 8 and 9 to extract a spectrum from another peak (Figure 11). The spectra are automatically overlaid in a stack plot layout.
Step 12
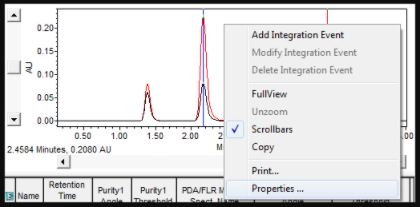
Any overlay (chromatograms or spectra) can be modified by right clicking in the plot and selecting properties (Figure 12).
Step 13
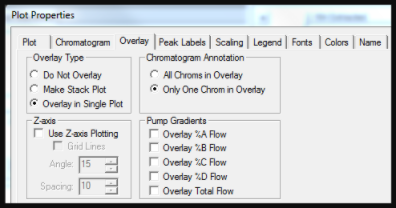
The overlay tab allows you to modify the overlay and the legend tab allows you to add information to the plot (Figure 13).
It’s that easy!
Final note:
This procedure can be followed using the QuickStart or Pro interface.
Next week in Empower Tip #35: Extracting Chromatograms and Spectra from 3D PDA Data (Part 2)
More resources:
- Want to learn more? Check out our Empower training courses and eLearning
- Get the latest Empower projects, options, and more. Check out the New Marketplace
- See all of our tips for using Empower CDS Software
- Comments? Connect with at #EmpowerTips or @WatersCorp on Twitter.
Submit an Empower 3 Review with Select Science. Write a review.