

Get Empowered: Review Window and the Processing Method | Tip #32
 152
152 
By Neil Lander August 29, 2017
Tip #32: Overlaying 2D Chromatograms from Different 3D PDA Channels
Welcome back to Get Empowered! In the last Empower tip-of-the-week blog for Empower Software, we explored a fourth option for calculating signal-to-noise ratio (#31) . This tip will demonstrate how to overlay a chromatogram at a particular wavelength from two different 3D PDA channels.
I recently received a question from a subscriber who asked how to overlay 2D channels of the same wavelength from different 3D channels. Thank you for the great question. I will show you two ways to do this and they are pretty simple.
Here’s the first way.
Step 1
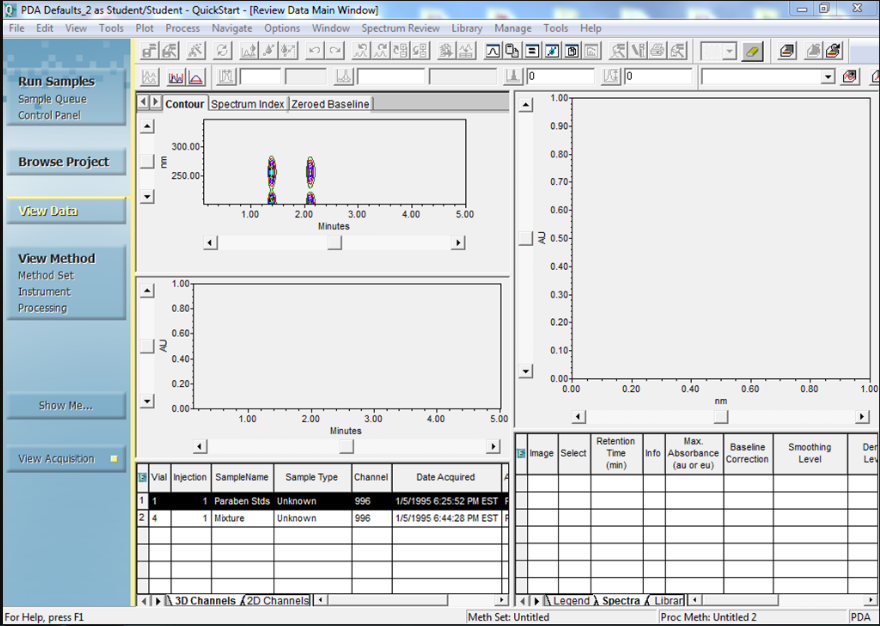
Let’s start by bringing two different 3D PDA channels into Review (Figure 1).
Step 2
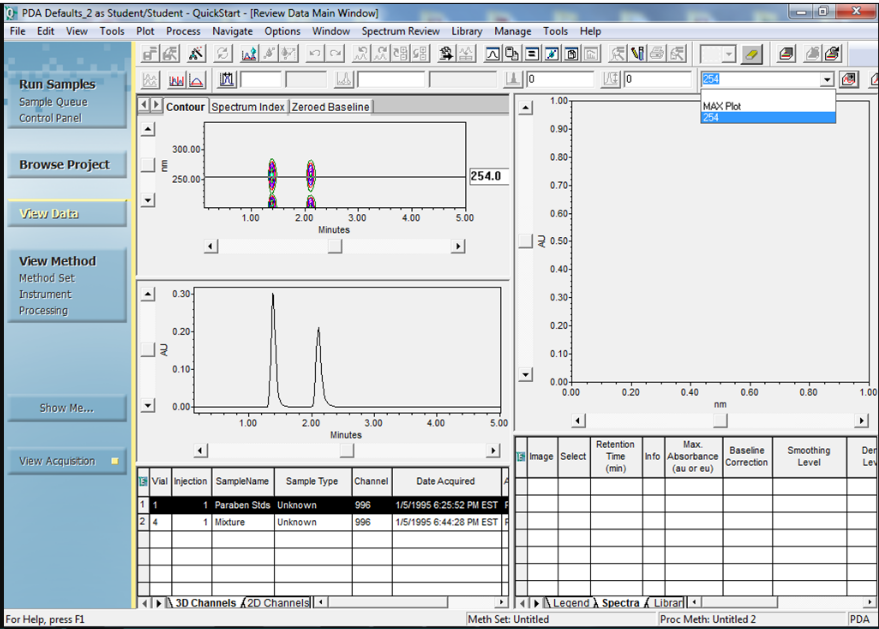
Extract a wavelength from the first channel. In this case, I chose 254 nm from the Extract Choices drop down list (Figure 2). (There are multiple ways of doing this, and I will cover this topic in a future tip for Empower Software.)
Step 3
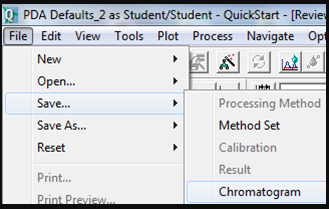
From the File menu select Save, Chromatogram (Figure 3).
Step 4
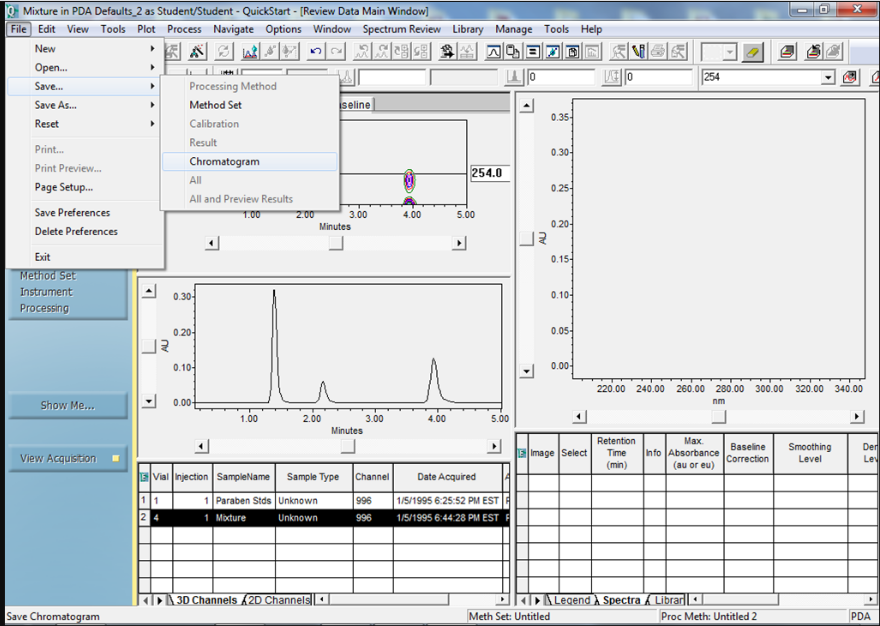
Repeat steps 2 and 3 for the second channel (Figure 4).
Step 5
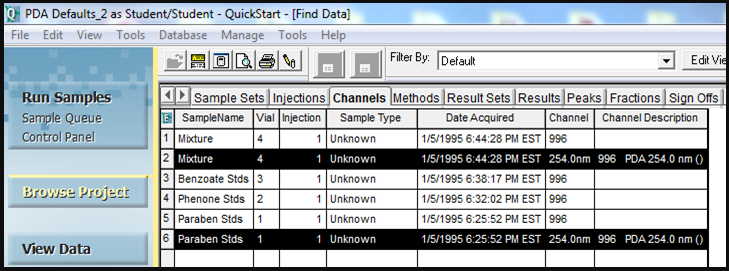
Exit out of Review. On the channels tab in Browse Project, notice there are now the single wavelength channels we saved (Figure 5).
Step 6
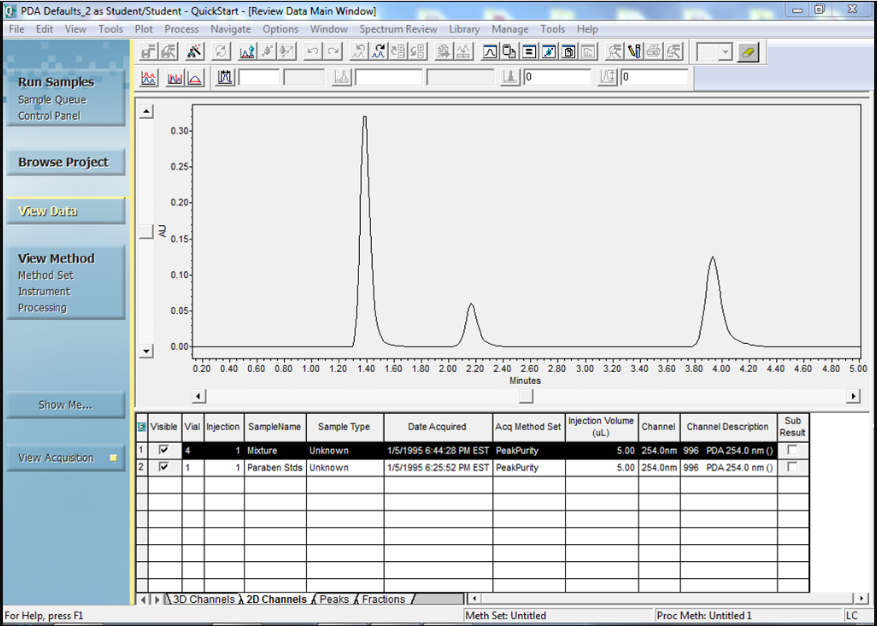
Bring the single wavelength channels into review (Figure 6).
Step 7
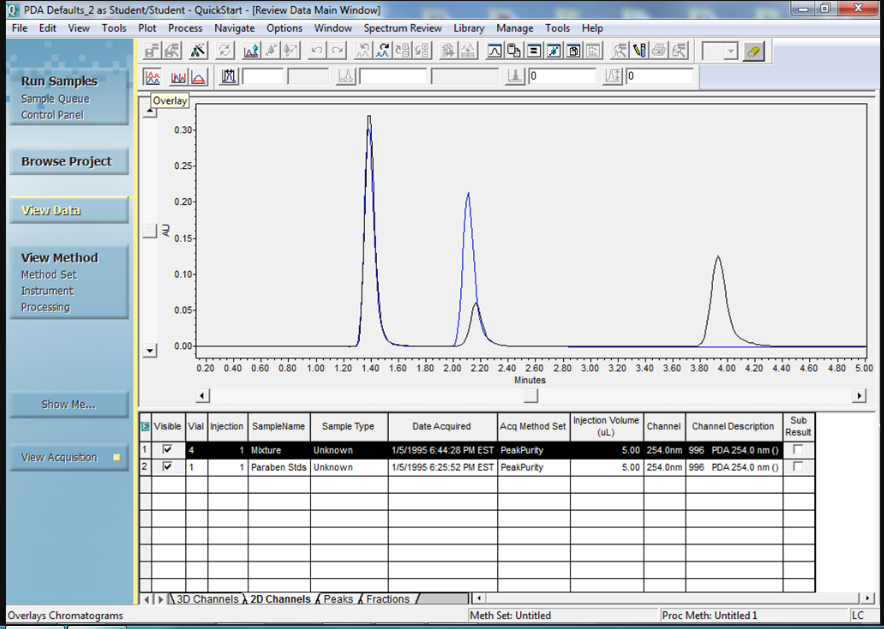
Click the Overlay tool (Figure 7).
Step 8
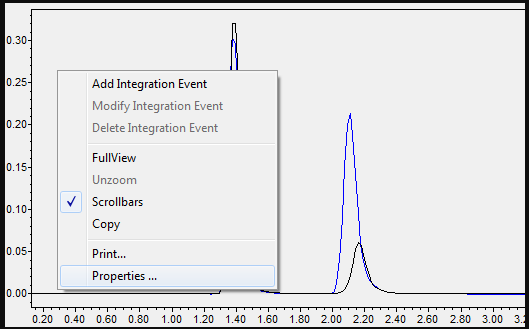
You can customize the overlay by right-clicking in the plot and selecting Properties (Figure 8).
Step 9
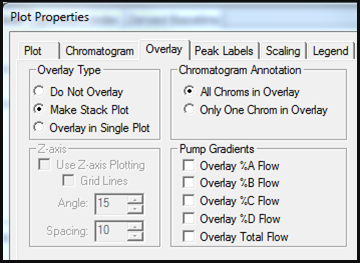
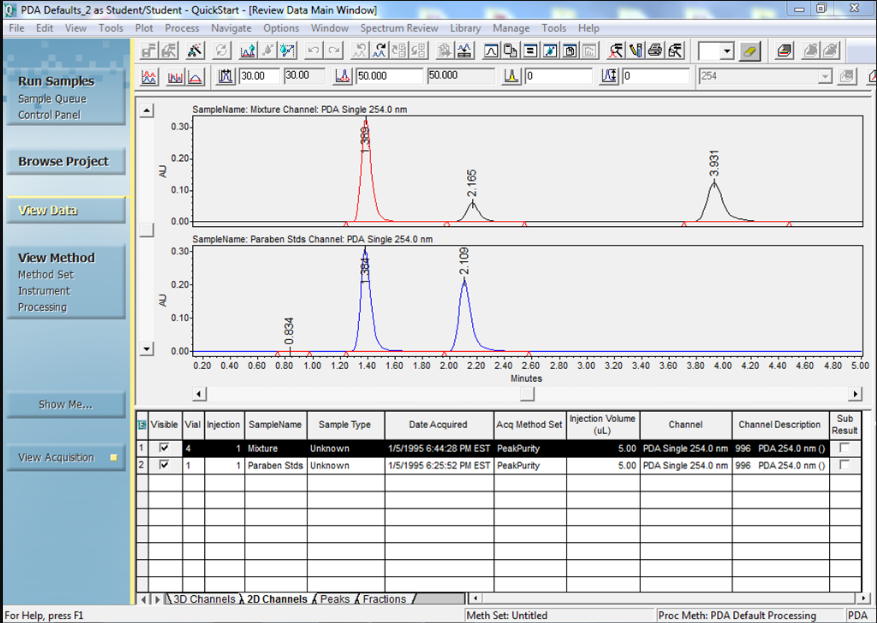
On the Overlay tab, you can change the display from Overlay in Single Plot to Make Stack Plot. Under Chromatogram Annotation, select All Chroms in Overlay (Figure 9).
Step 10
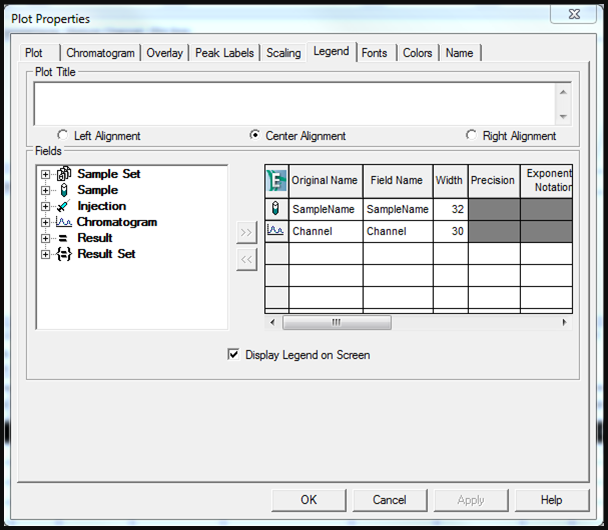
On the Legend tab you can add the Sample Name and the Channel (which displays the wavelength). Select Display Legend on Screen (Figure 10). Then click OK.
Step 11
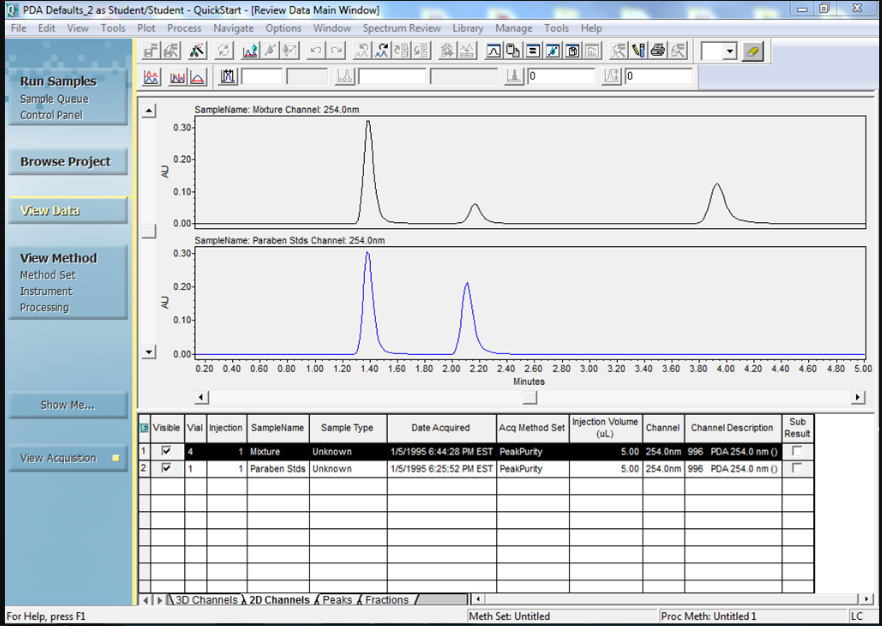
We now have a modified overlay and both channels are labeled with the Sample Name and wavelength (Figure 11).
That is one way to do it. Here is another way.
Step 12
Once the 3D channels have been processed, you can overlay the chromatograms easily. On the Results tab select the results (Figure 12).

Step 13
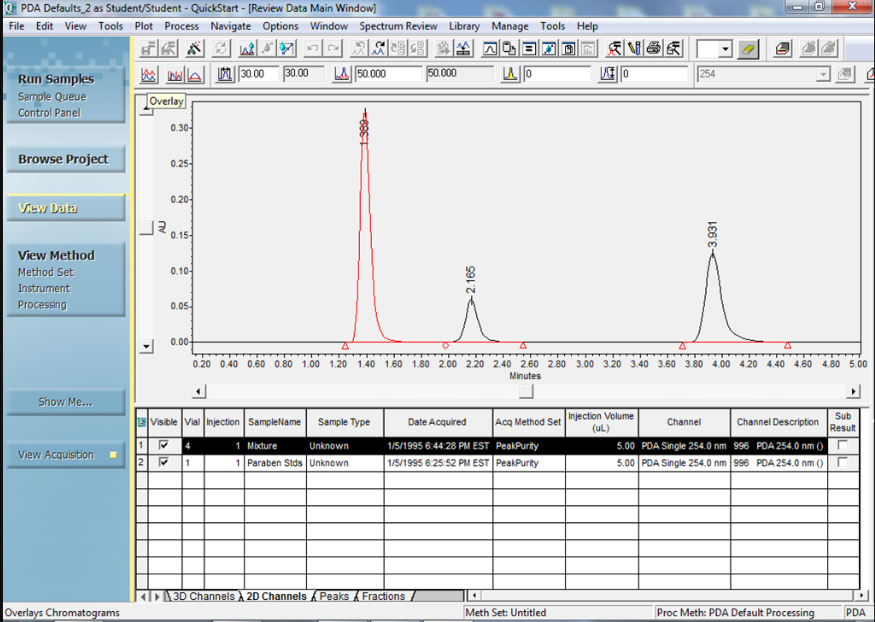
Bring the results to Review and click the Overlay tool (Figure 13).
Step 14
Modify the properties of the overlay as described in steps 8 to 11. Once again, you have an overlay with both channels labeled properly (Figure 14).
It’s that easy!
Final note:
- This procedure can be followed using the QuickStart or Pro interface.
Next week in Empower Tip #33: Reusing an Older Calibration Curve.
More resources:
- Want to learn more? Check out our Empower training courses and eLearning
- See all of our tips for using Empower CDS Software
- Comments? Connect with at #EmpowerTips or @WatersCorp on Twitter.
- Submit an Empower 3 Review with Select Science. Write a review.