

Get Empowered: Review Window and the Processing Method | Tip #31
 191
191 
By Neil Lander August 23, 2017
Tip #31: Calculating signal-to-noise ratio (Part 4)
Welcome back to Get Empowered! In this mini-series for our tip-of-the-week blog on using Empower Software, we’re exploring how to calculate signal-to-noise (S/N) ratio. This tip will demonstrate a fourth option, using custom calculations.
- Part 1, calculating S/N using peak height divided by noise (#28)
- Part 2, calculating S/N from within a chromatogram (#29)
- Part 3, calculating S/N from a blank injection (#30)
If you work in a non-regulated laboratory and do not have the System Suitability option for Empower Software, you may still need to calculate signal-to-noise ratio. We can do this by creating a simple custom calculation. Sound difficult? Well it isn’t. Let me show you how.
Step 1
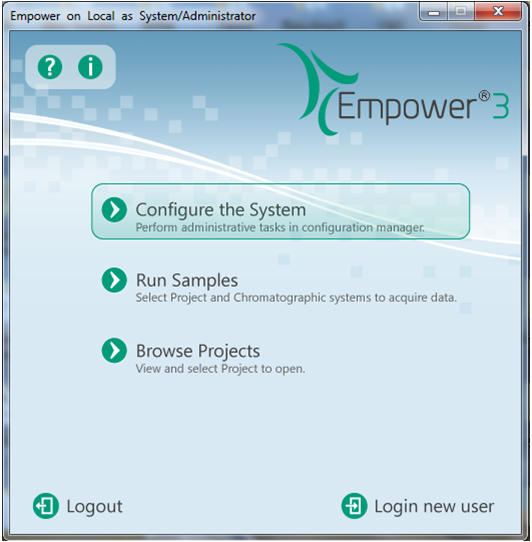
Let’s start by creating the custom calculation. This is done in the properties of your project. Go to the Configuration Manager window by clicking Configure the System from the Pro Interface (Figure 1).
Step 2
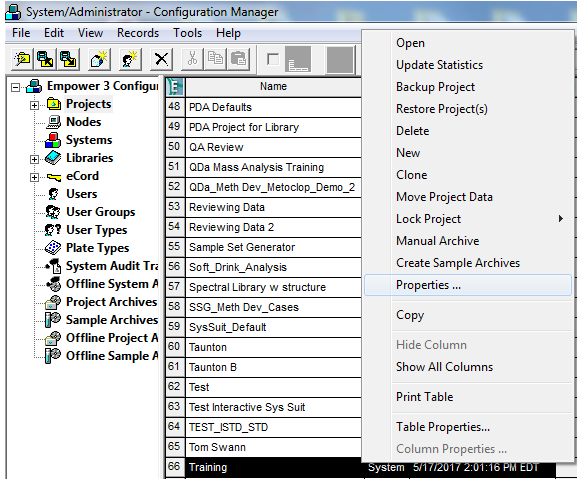
Right-click on the row number for your project and select Properties (Figure 2).
Step 3
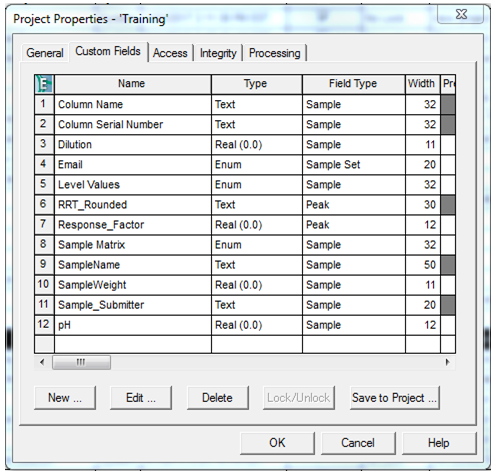
Click the Custom Fields tab and then click the New button to launch the New Custom Field Wizard (Figure 3).
Step 4
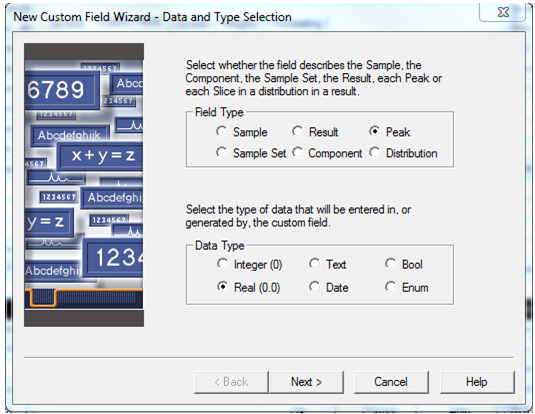
On the Data and Type Selection screen, select Peak for the Field Type and Real for the data type (Figure 4). A peak custom field is a calculation that can be applied to every peak in the chromatogram. Click Next.
Step 5
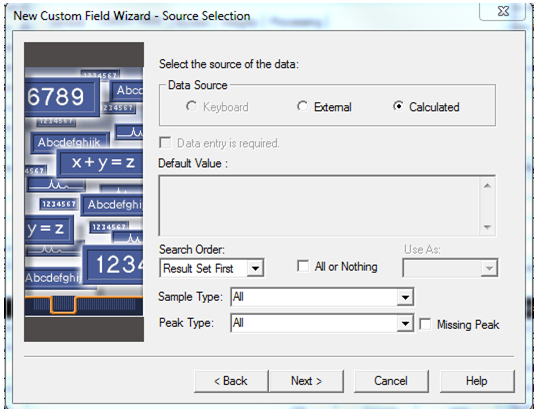
Do not change anything on the Source Selection screen (Figure 5). Click Next.
Step 6
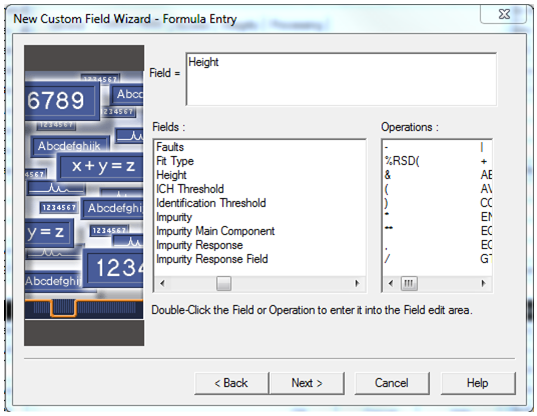
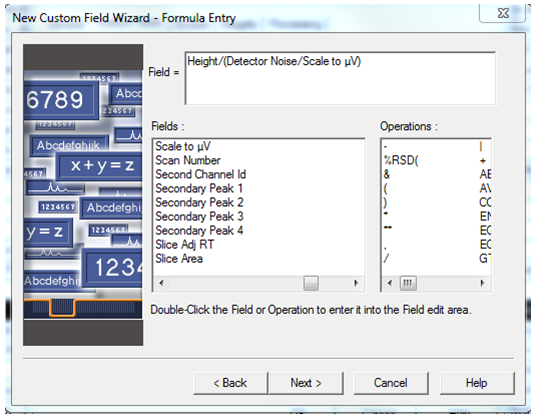
We will enter the formula on the Formula Entry screen. Signal-to-noise ratio is peak height divided by detector noise. In the Fields list scroll to the right and double-click on Height (Figure 6).
Step 7
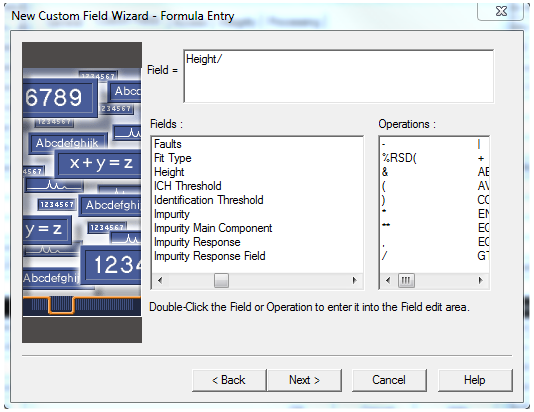
From the Operations list, double-click the forward slash, which is the division symbol (Figure 7).
Step 8
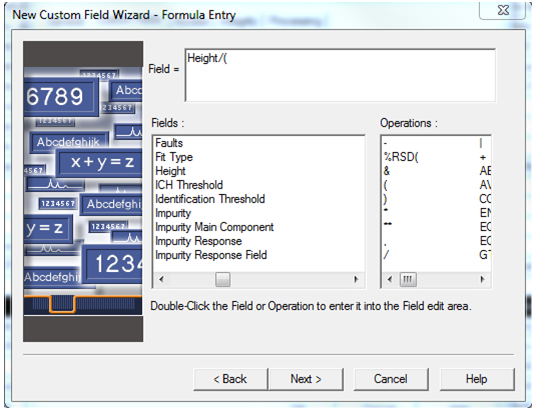
Height is in microvolts and detector noise is in plot units, so we will need to correct for the difference in units. In the denominator enter a left parenthesis (Figure 8).
Step 9
In the Fields list, locate Detector Noise and double-click to add it to the formula. Then double-click the forward slash (Figure 9).

Step 10
In the Fields list, locate Scale to uV and double- click to add it to the formula. The Scale to uV will correct for the difference in units. Then add the right parenthesis (Figure 10). Click Next.
Step 11
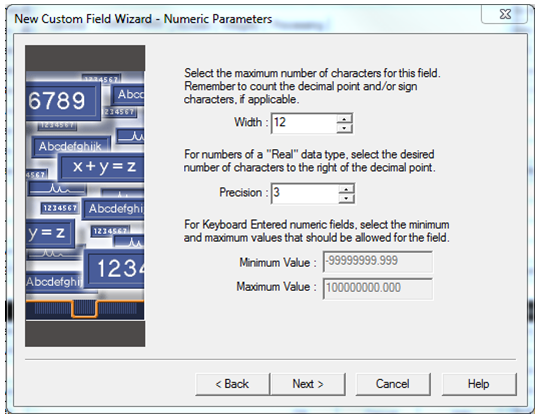
Set the desired precision on the Numeric Parameters screen and click Next (figure 11).
Step 12
Enter a name on the Name Entry screen and click Finish (Figure 12). Note: you cannot use spaces in the name but could do shift underscore.
Step 13
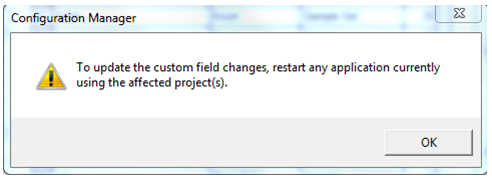
Click OK to the warning message (Figure 13).
Step 14
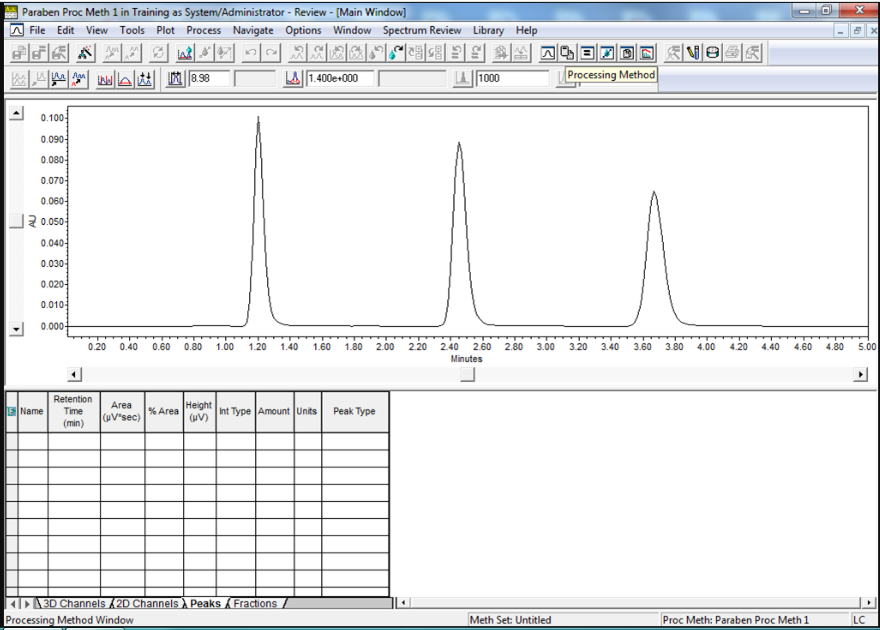
Now let’s use the custom field. Open the project and bring raw data (Sample Set, Injection or Channel) into review and open the Processing Method. Click the Processing Method tool (Figure 14).
Step 15
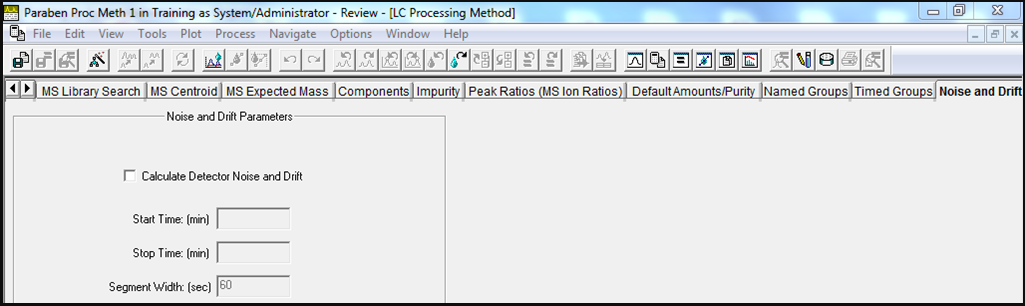
Click the Noise and Drift tab (Figure 15).
Step 16
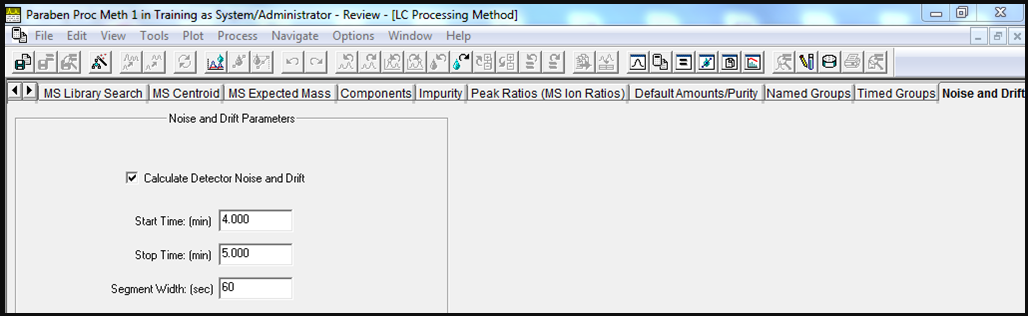
Check the box for Calculate Detector Noise and Drift and enter a time interval that is free of peaks for calculating noise (Figure 16). This time region must be equal to or greater than the Segment Width and must contain at least 60 data points. The Segment Width is used for calculating average noise and drift values and it must contain at least 30 data points.
Step 17
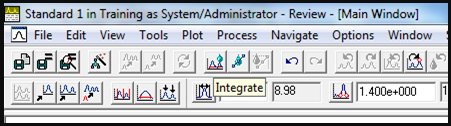
Return to the Main Window and click the Integrate tool (Figure 17).
Step 18
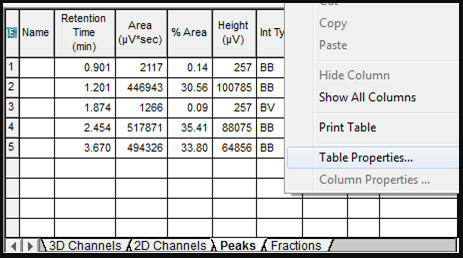
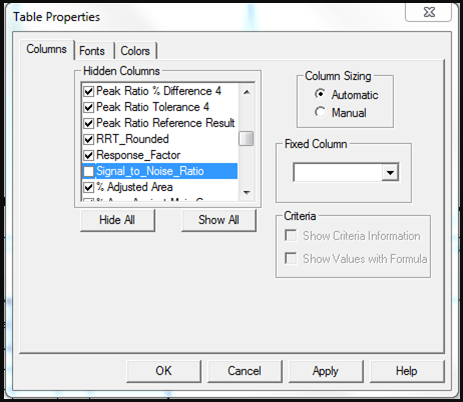
If signal-to-noise ratio is not visible we can add it to the Peaks table. Right-click on the Peaks table and select Table Properties (Figure 18).
Step 19
On the Columns tab, find signal-to-noise ratio and remove the check mark to make it visible in the table (Figure 19). Click OK.
Step 20
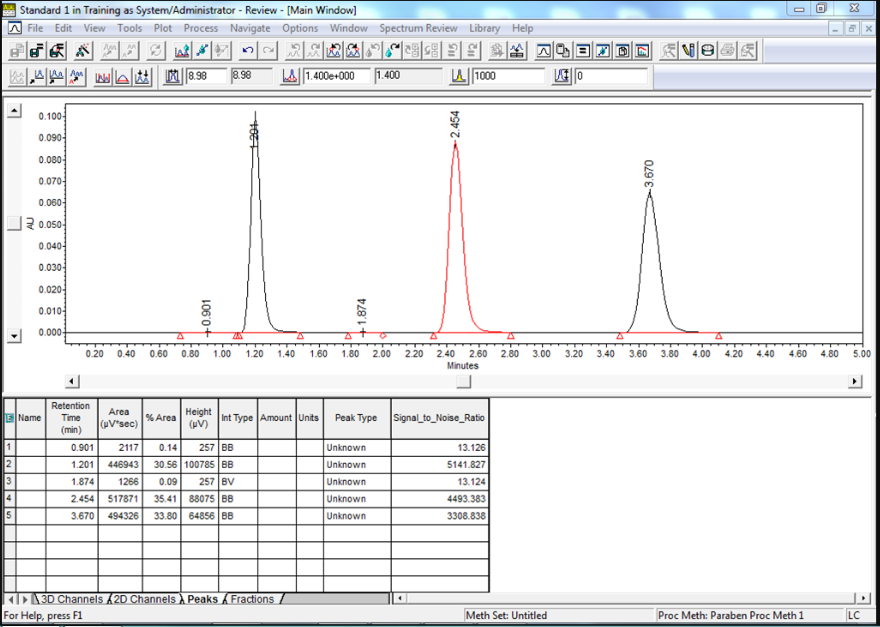
The signal-to-noise ratio is displayed for every integrated peak (Figure 20).
It’s that easy!
Final note:
- This procedure can be followed using the QuickStart interface. In step 1 described above, select Configuration from the Manage menu.
Next week in Empower Tip #32: Overlaying 2D Chromatograms from Different 3D PDA Channels
More resources:
- Want to learn more? Check out our Empower training courses and eLearning
- See all of our tips for using Empower CDS Software
- Comments? Connect with at #EmpowerTips or @WatersCorp on Twitter.
- Submit an Empower 3 Review with Select Science. Write a review.